Quick start
Installation
Install using pip
pip install tnsgrt
See matplotlib and vispy for tweaking visualization settings.
Source code
Code corresponding to the sections in this guide are distributed in the form of Jupiter notebooks and can be found at the examples directory in the source code repo.
Hello World
Try the following code
from tnsgrt.prism import Prism
s = Prism()
The object s is a tnsgrt.structure.Structure representing a Snelson Tensegrity Prism with three
bars and nine strings such as the one in the following figure:
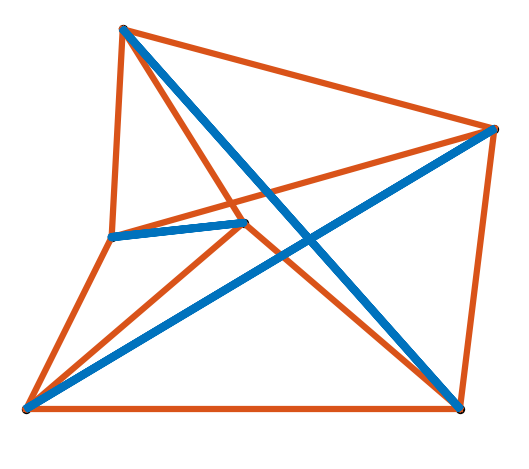
The structure can be visualized using matplotlib
from matplotlib import pyplot as plt
# add your favorite matplotlib magic below
%matplotlib widget
and tnsgrt.plotter.MatplotlibPlotter
from tnsgrt.plotter.matplotlib import MatplotlibPlotter
to produce a 3D plot like the one in the figure above
plotter = MatplotlibPlotter()
plotter.plot(s)
plt.axis('equal')
plt.axis('off')
plt.show()
The underlying figure and axis can be retrieved and used to manipulate the plot
fig, ax = plotter.get_handles()
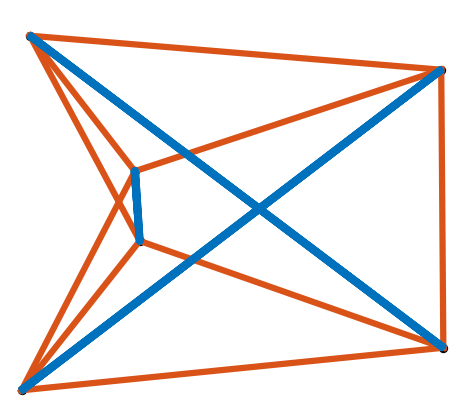
ax.view_init(elev=20, azim=45, roll=0)
plt.show()
which in this case rotates the plot to obtain the better viewpoint
Prisms, lots of prisms
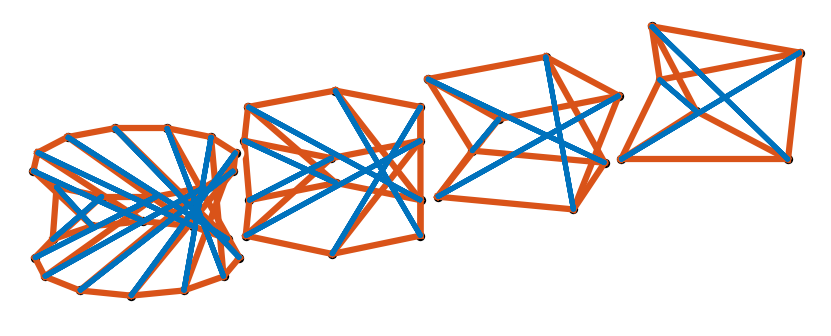
It is possible to construct Snelson prisms with different number of bars
prisms = [Prism(n) for n in (3, 4, 6, 12)]
All prisms are constructed centered at the origin. They can be translated
import numpy as np
prisms = [prism.translate(np.array([3*i,0,0])) for i, prism in enumerate(prisms)]
before plotting
plotter = MatplotlibPlotter()
plotter.plot(prisms)
plt.axis('equal')
plt.axis('off')
plt.show()
fig, ax = plotter.get_handles()
ax.view_init(elev=30, azim=60)
ax.set_box_aspect(None, zoom=1.8)
to produce a plot such as:
Plotting with VisPy
It is also possible to plot structures using VisPy. Certain users might need to tweak their installations. See installation instructions for details.
The above prisms can be plotted with VisPy
from IPython.display import display
import jupyter_rfb
from tnsgrt.plotter.vispy import VisPyPlotter
plotter = VisPyPlotter(scene={'size': (800,200), 'app': 'jupyter_rfb'},
                       camera={'scale_factor': 6, 'center': (4.5,2,0)})
plotter.plot(prisms)
plotter.get_canvas()